Trend Extrapolation/Trend Impact Analysis
Kursthemen
-
-
● Trendextrapolation (engl.: Trend-Extrapolation) ist eine Methode, bei der Daten aus der Vergangenheit in die Zukunft projiziert werden, wobei davon ausgegangen wird, dass bestimmte Phänomene wahrscheinlich fortbestehen werden.
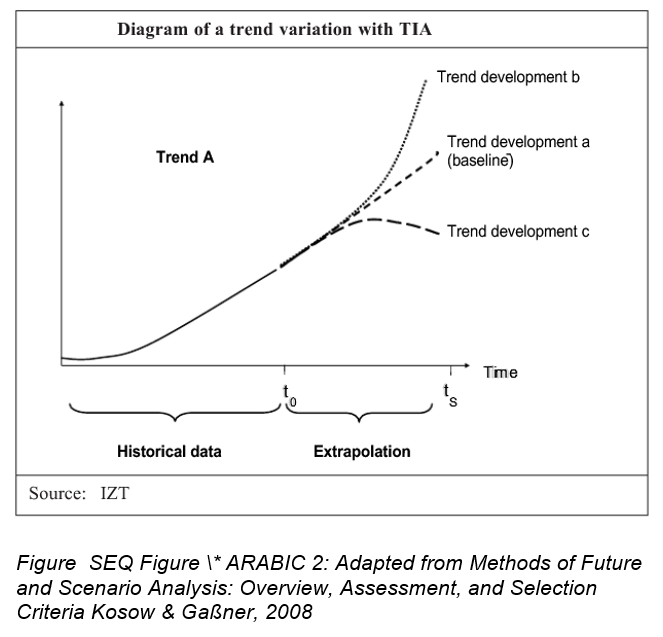
● Trendauswirkungsanalyse (engl.: Trend-Impact-Analysis; kurz: TIA) ist eine Prognosemethode, welche historische Daten in die Zukunft extrapoliert und dabei die Erwartungen an zukünftige Ereignisse berücksichtigt.
● Wechselwirkungsanalyse (engl. Cross-Impact-Analysis; kurz: CIA) ist eine Prognosemethode, welche auf der Idee beruht, dass alle Trends und Ereignisse, welche in Verbindung mit einem Thema stehen, sich gegenseitig auf unterschiedliche Weise beeinflussen können. Sie wird verwendet, um diese Wechselbeziehungen zwischen den Variablen zu verstehen, indem Expertenmeinungen berücksichtigt werden.
-
Forum
-
-
-
Trend extrapolation:
The best way to visualize future developments is by extrapolation of existing developments. It is assumed that whatever happened in the past will continue in the future. Trend extrapolation is a forecasting technique that takes a historical trend over time and extrapolates the trend line into the future (Kosow & Gaßner, 2008). Data is collected and processed, then logical or systematic development processes are identified before being statistically projected into the future.
Trend extrapolations are often shown as line graphs with a dependent variable on the y-axis and the time period on the x-axis. Levin, Rubin, & Stinson (1986) define the different "levels" of trends as constant, linear, exponential, and damped.
Trend Impact Analysis (TIA):
Trend Impact Analysis was developed in the late 1970s (Gordon, 1994). It allows a study of the different possible courses of events within a trend. Trend Impact Analysis is a forecasting method that permits extrapolations of historical trends to be modified taking into account expectations about future events (Kosow & Gaßner, 2008). Trend Impact Analysis uses the point of departure as the “surprise-free” projection, assuming an absence of unprecedented future events (Kosow & Gaßner, 2008). Expert opinions are then used to identify future events that might cause deviations from the surprise-free projection.
Cross-Impact Analysis (CIA) vs. TIA:
Before TIA, Theodore J. Gordon and Olaf Helmer developed CIA in 1966 (Gordon, 2009b, 1). CIA is a forecasting method with the purpose of predicting possible and probable futures beyond simple trend extrapolation and has multiple similarities to the TIA method. Both are considered mixed (hybrid) methods, since qualitative elements (in terms of expert opinions) are included in the judgment process resulting in quantitative probabilities assigned to future trends and events. While in TIA trends and events are considered independent of each other so it focuses solely on one particular trend ( including all variables that might affect that trend), CIA follows the idea that all trends and events related to an issue have to be taken into account, since they can collide and change each other in different ways (e.g. by increase,reversal,end,etc.). Therefore, it is reasonable to understand the interplay and these interrelationships between the variables, using the CIA.(Gordon, 2009b, 4-5)
Unlike TIA, no historical data sets are used in the CIA method. Qualitative expert opinions are used to assign initial quantitative probabilities for trends and events in the future.These probabilities are mapped against each other in a matrix. After that, a conditional probability estimation process starts by experterts estimating the conditional probabilities of two trends/events in a row/column. This is where the ,,cross” in the ,,cross-impact” shows.
The calculation of the ,,impact” is usually comupter-run, using a Monte Carlo simulation (also used in TIA). In this simulation, a calibration run goes through every part of the matrix converting probabilities to odds and calculating odd-ratios in order to find out how the probabilities of trends/events change when other trends/events do or do not occur. Further adjustment is made by testing each trend/event in random order by picking random probability values and multiplying initial odds with occurance ratios of given trends/events. The final cross-impact matrix is given as a result, determining the final occurance frequencies of each trend/events and consequently their final probabilities. (Gordon, 2009b, 8-9)
TIA has been recently applied for example in the agricultural sector in order to estimate future wheat supplies in India, the consumption of fresh fruit in the Netherlands or the eucalyptus cultivation in Brazil (Ray et al. 2017, 129), while CIA finds application in patent analysis in order to forecast future technologies and also to facilitate discussion about future changes in the automotive sector.(Gordon, 2009b, 14-15)
-
-
-
Trend extrapolation methods are generally used for predicting trends of admission, enrolment and completion. In teaching, trend extrapolation can be used for analyzing historical data or making predictions by taking a current event with a known quantity and projecting it into the future. Extrapolation uses forecasting, which involves predicting future outcomes based on past information or trends, and then, as part of a trend analysis, identifies these trends over time to predict future results.
Armstrong (2001) recommends using trend extrapolations:
- when a large number of forecasts are needed
- when the forecaster is ignorant about the situation
- when the situation is stable
- when other methods would be subject to forecaster bias
- as a benchmark in assessing the effects of policy change
Simplilearn (2022) outlines different extrapolation methods that can be used:
o Linear extrapolation assumes there will be no change in the relationship between two variables. It uses a linear equation or function, allowing for a drawing of a tangent line at the endpoints of the graph and extending it past the limits of the data set.
o Polynomial uses the method of Lagrange interpolation to find the polynomial curve between known values or near endpoints of a function. It is a technique for estimating a mathematical expression that uses any approximate state for the independent variable. Interpolation is mostly used to identify what additional data may exist outside of the received data (Simplilearn, 2023).
o A Conic section is a curve obtained using five points near a given data set. The curve will always curve back to itself as long as the data set involves a circle or ellipse. According to ScienceStruck (2023) this method is mostly implemented using software.
o French Curve extrapolation uses an existing set of data to forecast the variable's value at a point not included in the original data. It is useful when there is a need to extrapolate from a small number of data points because it does not require any assumptions about the relationship between the variables.
o Geometric Extrapolation with Error Prediction estimates the value of a variable at some time in the future based on how the variable's values have changed over time. This is often applied to stock prices.
The trend extrapolation method can be used in class, for example, to project the total population size of a district, city, town, a rural area and to determine future demand for basic services such as safe water, fire and police protection, as well as electricity and health care services for a total population (MEASURE Evaluation, n.d).
Trend Impact Analysis (TIA) is generally used in planning and predicting future outcomes, to project future revenue and cost line items, to examine sales trends, for investigating odd expenditures in a reporting period or for the purpose of examining expense report claims (Jones, 2022). TIA can be divided into three different categories, according to Jones (2022):
o The Temporal Approach is mostly employed in event-focused studies and ethnographic research to examine patterns, trends, and changes in a group of data or study subjects over time.
o The Intuitive Approach is used to examine trends among user groups to look at logical justifications, behavioral trends, or other factors. This approach can be challenging as it may not be that accurate.
o The Geographic Approach can be applied to find similarities and differences across user groups looking at geographic locations.
Trend Impact Analysis can be used in teaching by using data to attempt to predict the direction the market will take moving forward. To perform a trend analysis, it is important to first determine the market segment to be analyzed, for example, a particular industry, such as the automotive or pharmaceuticals sector, and a specific type of investment, such as the bond market. Then, its general performance should be examined, for example, how the sector was affected by internal and external forces impacting the market (Hayes, 2023).
While TIA is more useful when there is only one concrete trend to focus on from the beginning, CIA can add more value to the usage in teaching, when there are multiple trends/events referred to an issue and there is no clarity about which one of them tends to be more relevant than the others. It can help rank trends/events by their potential influence in order to decide which ones to focus on (Karhapää, 2019, 119).
Different teaching materials can be used in class. Aurecon (2023) has curated the Futures Playbook providing a set of plays, tools and processes in order to explore and make sense of potential futures based on strategic foresight frameworks and theories. The Trend Implication Analysis play is designed to help users identify various drivers of change, impacts and implications, and find actions that can be taken. Aurecon’s Facilitation Guide on Trend Implication Analysis can be found here.
The process of the Trend Implication Analysis play is as follows:
- Identify the trends to explore (Select a topic or area for investigation or ask the group to brainstorm the trends to explore)
- Describe the trends in focus
- Identify what could change
- Identify the implications of this change
- Uncovering the meaning
- Optional – Identify next steps
- Optional – Debrief
-
-
-
Armstrong, J. S. (2001). Standards and Practices for Forecasting. In Principles of Forecasting: A Handbook for Researchers and Practitioners, 679-732. https://doi.org/10.1007/978-0-306-47630-3_31
Aurecon Group (2023). Trend Implication Analysis.
Gordon, T. J. (1994). Trend Impact Analysis. AC/LW f/Millennium Project Futures Research Methodology. Futures Research Methodology.
https://www.foresight.pl/assets/downloads/publications/Gordon1994-Trendimpact.pdf
Gordon, T. J. (2009b). Trend Impact Analysis. Futures Research Methodology - V3.0. The Millenium Project. CD-ROM
https://www.millennium-project.org/publications-2/futures-research-methodology-version-3-0/
Hayes, A. (2023, January 02). Understanding Trend Analysis and Trend Trading Strategies. Investopedia.
https://www.investopedia.com/terms/t/trendanalysis.asp
Jones, O. (2022, December 2). Trend Analysis – Its advantages and 3 types. Fynzo.
https://www.fynzo.com/blog/trend-analysis/
Karhapää, J. (2019). Beyond Simple Extrapolation: Trend-Impact Analysis and Cross-Impact Analysis. COOLEST STUDENT PAPERS AT FINLAND FUTURES RESEARCH CENTRE 2017–2018, 115-123.
Kosow, H., & Gaßner, R. (2008). Methods of Future and Scenario Analysis: Overview, Assessment, and Selection Criteria. (DIE Studies, 39). Bonn: Deutsches Institut für Entwicklungspolitik gGmbH.
https://nbn-resolving.org/urn:nbn:de:0168-ssoar-193660
Levin, R., Rubin, D., & Stinson, J. (1986). Chapter 3: Forecasting. In Quantitative approaches to management. NY: McGraw-Hill. http://techweb.bsu.edu/jcflowers1/rlo/tatrend.htm
MEASURE Evaluation (n.d.). Lesson 6.
Ray, Mrinmoy & Rai, Anil & Singh, K.N. & V., Ramasubramanian & Kumar (2017, February).
Technology forecasting using time series intervention based trend impact analysis for wheat yield scenario in India, Technological Forecasting and Social Change, Vol. 118, 128-133. https://doi.org/10.1016/j.techfore.2017.02.012
ScienceStruck (2023, May 14). A Well-defined Guide on Interpolation Vs. Extrapolation.
https://sciencestruck.com/interpolation-vs-extrapolation
Simplilearn (2022, December 14). What is Extrapolation? Everything You Need To Know.
https://www.simplilearn.com/tutorials/statistics-tutorial/what-is-extrapolation
Simplilearn (2023, May 14). What is Lagrange Interpolation? An Overview.
https://www.simplilearn.com/tutorials/statistics-tutorial/lagrange-interpolation
Smith, S. K., Tayman, J., & Swanson, D. A. (2002). Trend Extrapolation Methods. In State and Local Population Projections. The Springer Series on Demographic Methods and Population Analysis (pp. 161-183). Springer, Dordrecht. https://doi.org/10.1007/0-306-47372-0_8
TUTORIALS FROM THE INTERNET – HOW TO USE THE METHOD:
● What is Interpolation and Extrapolation?
● Extrapolation
● Extrapolation in Statistics: Explanation, Techniques, and Real-Life Examples (Need Account to Watch)
https://study.com/academy/lesson/extrapolation-in-statistics-definition-formula-example.html
RESEARCH PAPERS OR SCIENTIFIC PUBLICATIONS ON THE METHOD:
● Manolov, R., Solanas, A., & Sierra, V. (2019). Extrapolating baseline trend in single-case data: Problems and tentative solutions. Behavior Research Methods, 51, 2847-2869.
https://link.springer.com/article/10.3758/s13428-018-1165-x
● Extrapolation: Lesson Plans: Lesson 3 Working with Outliers
● 5.1 Trend extrapolation (in German)
https://docplayer.org/192392034-5-1-trendextrapolation.html
● What is Trend Analysis
https://www.igi-global.com/dictionary/trend-analysis/39116
● Trend Analysis: What Is It and Why Is It Important?
https://365datascience.com/trending/trend-analysis/
-